
Marketing forecasting is a data-driven method of predicting future market trends and business revenue. An accurate marketing forecast takes the guesswork out of planning your marketing timelines, strategies, calendars and budgets. Luckily for marketing teams, they now have an abundance of marketing data streams at their disposal. But all that data needs to be analysed in a way that provides an accurate projection for the future.
You might be wondering, what’s the best way to analyse all that information? There is no one correct method, but rather multiple techniques that can be used collectively to project company growth as accurately as possible.
The following article looks at some of the most useful methods and techniques used in marketing forecasting.
1. Time Series Analysis & Forecasting
To put it simply, time series analysis means looking at historical data and using it to predict or explain trends. For this kind of analysis, you must be able to access historical sales and marketing data recorded over a period of time and evaluate it for patterns.
These patterns can be used to create models that predict future growth. If, for example, between 2018 and 2020 lead generation for your marketing campaigns via Google Ads was 3.75%, then your conversion rates will likely remain the same in the coming year. This form of analysis is best suited for overall marketing forecasts – which is why we use this technique in TrueNorth to forecast growth projections.
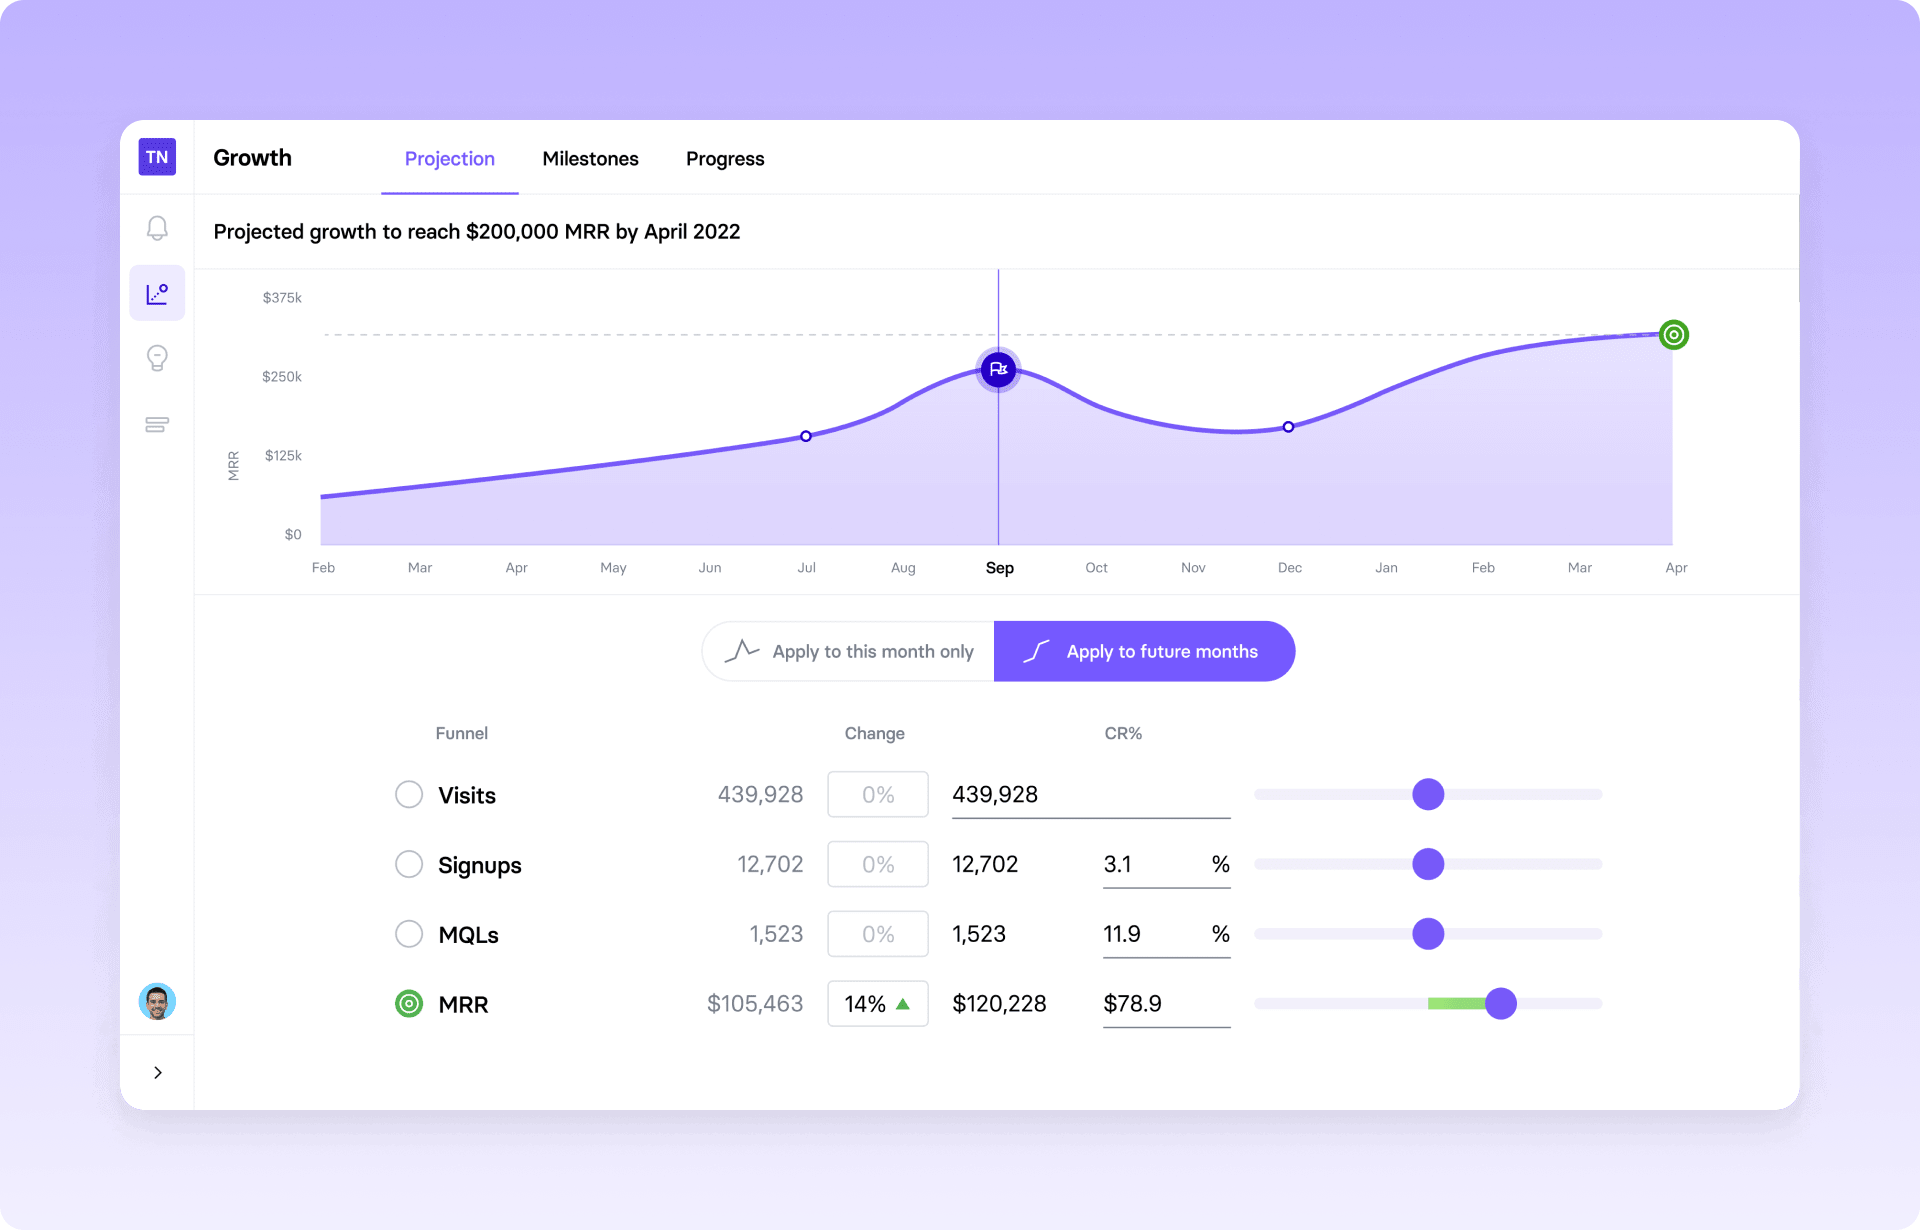
Within time series forecasting, there are a number of different models for extrapolating data into the future. While linear regression may be the most commonly, it is arguably the least realistic in a marketing context as it predicts a consistent increase indefinitely over time.

For growth projections, a logarithmic or moving average forecast should better reflect the realities of marketing performance starting slower and building momentum over time up to a point of saturation.
2. Qualitative Techniques
If quantitative analysis looks at the “what” of customer behaviour, then qualitative seeks to explain the “why”. Speaking directly with customers, carrying out surveys, focus groups, and interviews can help you get a better idea of the feelings, thoughts, and needs of your target market.
While it can sometimes be challenging to quantify this data, it’s still key information that can be used to forecast future market trends and project potential sales figures. It’s also a useful tool for when you lack other reliable information streams, for example, with a new product that does not come with much historical sales data.
3. Statistical Demand Analysis
Marketing forecasting is heavily tied to sales forecasting, and one can’t exist without the other. To predict future sales, you need to have some understanding of the expected demand for your products and services in the coming months or years.
Statistical demand analysis uses mathematical models to analyse historical sales data and use it to predict future demand. This can be based on seasonal factors — for example, your bikini sales predictably increase every summer — but it also works for products that have intermittent erratic demand.
If you know when the market is most likely to demand your product, you can create a marketing forecast that reflects these patterns.
4. Test Marketing
If you have a new product or a new market, it can be difficult to create future marketing projections. This is where test marketing comes in. You take your product, test it within a smaller market, and use the data gained from this experiment to predict future outcomes before the main launch.
You can also use test marketing to create a test market vs. control market gap analysis. This means that you launch the product or service in two small test and control markets, but you only promote and advertise it in the control region. You can then use this data to analyse the sales gap, providing greater insight into the effectiveness of future marketing campaigns.
5. Leading Indicators
If a lagging indicator is a KPI that tells you something about past performance, then a leading indicator gives you information about the future. For example, if you’re trying to lose weight, then a lagging indicator would be your current number on the scales. A leading indicator would be the number of calories you consume per day, as this is likely to predict your future weight loss or gain.
If you’re trying to develop a marketing forecast, you must be able to analyse your leading indicators. It could include your number of website visitors, social media impressions, email open rates, subscribers, or rate of published articles to name a few. Analysing your leading indicators determines which marketing campaigns are likely to generate the most leads.
6. Correlation Techniques
When analysing statistical information, the data can present interesting and useful correlations. For example, a website’s bounce rate may correlate with the conversion rate. By measuring current bounce rates, marketing forecasters may then be able to project future conversion rates.
Importantly, correlation doesn’t always indicate causation, but it points marketers in the direction of possible causations. These can then be investigated and drive experiments, which can be used to improve marketing forecasting.
You Need The Right Marketing Forecasting Tools
With so much marketing data on our hands, we need the right software to help us do the analysis. Modern solutions can take information from multiple streams and use the above methods to produce accurate marketing forecasts. These growth projections can help guide our marketing strategies, goals and timelines.
For a tool that can do this for you, take a look at TrueNorth’s growth projection and forecasting feature.


